

An electrocardiogram, or ECG, records the electrical activity of a patient’s heart. An ECG machine captures electrical signals during multiple heartbeats. Most ECG machines have a built-in printer that can conveniently print the ECG results for medical professionals to review and interpret.
This goal of this guide is to assist you with reading 12 lead ECGs for consistent results when performing an electrocardiogram interpretation.
- What is an ECG?
- How to Read ECG Waves and Waveform Components
- Patient Assessment
- Study Normal Sinus Rhythm ECG Patterns and Waves
- Use an Organized Approach
- Heart Rate Determination – How to Read Heart Rate on ECG
- Axis Determination
- Abnormal Rhythms and Waves
- Bundle Blocks and Chamber Hypertrophies
- Acute MIs and Ischemic Findings
What is an ECG?
Electrocardiograms are one of the oldest and simplest cardiac investigation tools. They remain essential to the modern assessment process for cardiac patients because they provide such informative and significant cardiac information.
During each heartbeat, the heart undergoes repolarization and depolarization, and these electrical currents are spread throughout the patient’s body. Patients may be assessed as in-patients at their bedside with the ECG machine on a cart or in an OR, in an ER, in a clinic, en-route in an ambulance. Animals are usually tested in a veterinarian’s office or an Animal Hospital. How to read an ECG monitor can be learned easily by nurses, doctors, EMTs or veterinaries.
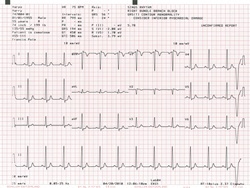
The ECG printout is a simple representation of electrical activity from the heart printed on ECG paper. As the heart muscle contracts, the electricity creates a graphic image that is printed out for easy analysis. Cardiac muscles, just like other muscle, contract as a response to the electrical depolarizationof the cardiac cells. This graphic representation of electrical activity, as the waves now been recorded and amplified, is an electrocardiogram, commonly referred to as an ECG or EKG.
Modern ECG machines allow surface ECGs using specialized cables and non-invasive disposable electrodes to be easily and quickly obtained right at the patient’s bedside or in many more mobile locations. Reading 12 lead ECG results at times be difficult to correctly interpret. ECG interpretation made incredibly easy is still unfortunately a bit of a myth, though image recognition software engineers are making strides in this direction.
How to Read ECG Waves and EKG Waveform Components
The waveform components are the individual wave elements used for electrocardiogram interpretation. Each waveform component indicates an individual electrical event during a single heartbeat. The waveform components are named simply P, Q, R, S, T and U. This is required for basic ECG interpretation.
The P wave is the short initial upwards movement on the EKG graph. This indicates the atria are contracting in the depolarization phase. This happens when they are pumping blood to the right and left ventricles.
The QRS complex, or ventricular depolarization, begins with the downward deflection. Normally, the QRS complex is 0.06 to 0.10 seconds. The short duration indicates the ventricular depolarization is normally occurring rapidly.
The Q is a large upward deflection. The R is the peak, and the S is a downward wave. The QRS complex is representative of the ventricular contractions and depolarization.
The PR intervals will indicate normal transit times for electrical signals travelling from sinus node to ventricles.
The time taken for ventricular depolarization and repolarization is represented by the Q-T interval. The T wave is a modest upward wave that represents ventricular repolarization.
Patient Assessment
Medical professionals need a complete picture to make informed medical decisions for the patient’s care. Before collecting EKG data and examining waveforms, it is important to start by assessing the patient:
- Can the patient talk easily, or do they struggle to catch a breath?
- Are you able to palpate peripheral pulses?
- Is the patient having any chest pains?
- How is the patient’s color?
- Is their skin clammy and damp or warm and dry?
Add your patient assessment to your ECG assessment and you will have a clearer understanding when developing your care plan. Knowing how to read 12 lead ECG and analyze the waves is of little help if you haven’t assessed the patient first.
Study Normal Sinus Rhythm ECG Patterns and Waves
How to read ECG step by step requires starting at the beginning. Begin by studying normal ECG wave patterns. Once you learn every nuance of a normal wave pattern, an abnormal pattern will jump from the page at you. Understand the normal amplitudes, deflections, and durations for every wave component and you will have a foundation for accurate rhythm and EKG interpretations.
The 12 electrical leads reflect the electrical currents through different planes of the heart. The 6 limb (I, II, III, AVR, AVL, AVF) leads are looking at the patient’s heart from the vertical perspective. The 6 precordial (V1-V6) leads are looking from the horizontal perspective.
This perspective often makes it easier to identify and interpret the areas of the heart that may be affected.
Use an Organized Approach
By creating a systematic and organized approach, your analysis of a 12 lead ECG will be more consistent and accurate. ECG interpretation practice is also key to successful results.
How to read ECG step by step:
1.Firstly, determine if the rhythm is regular. Examine the PQRST waves. Use calipers if necessary and available, or just use a piece of paper to track the P waves and the QRS complexes. Mark them with a pencil to see if they are marching along well or if there are gaps.
2.Next, determine if the rhythm is slow or fast.
3.Finally, examine ST segments for elevations or depressions. Use that piece of paper again to help evaluate the heights. If the elevations or depressions are obvious without using the paper, be ready to act quickly!
Heart Rate Determination – How to Read Heart Rate on ECG
Normal ECG heart rates, bradycardia or tachycardia all require calculation of the atrial rate based on the rate of the P wave, and the ventricular rate based on the rate of the QRS complex.
How to read ECG results for heart rates:
A regular heart rate is calculated by counting the number of large squares that are present in one R-R interval then dividing 300 by that number. For example, if there are 4 large squares in the R-R interval, 300 divided by 4 equals a heart rate of 75 beats a minute.
With irregular heartbeats where the R-R interval varies significantly you will need a different method:
Begin by checking the normal QRS interval and counting the number of QRS complexes on the 10 second rhythm strip. Multiply that number by 6, which gives the average QRS complexes in a minute. For example, if there are 11 QRS complexes on the strip X 6 equals 66 beats per minute.
Compare the rates to normal ECGs. For adults, normal is anywhere between 60 and 100 bpm. Tachycardia is more than 100, and Bradycardia is fewer than 60.
If there are obvious P waves, be sure to check both the atrial and the ventricular rates. Both rates will have the same value if 1:1 AV conduction is present.
Axis Determination
By determining the axis on the patient’s ECG, you can quickly get an idea for several pathologic states. The cardiac axis is a description of the general direction of the spread of electricity in the heart.
How to read ECG graphs to determine the axis:
To begin, only the QRS complex axis requires analysis.
The axis in a healthy heart spreads from the 11 o’clock to the 5 o’clock positions. Lead II will have a more positive deflection than both Leads I or III.
With a right axis deviation, you will notice that Lead III will have a more positive deflection, and that Lead I will be negative. A diagnosis of right ventricular hypertrophy is common.
With a left axis deviation, you will notice that Lead I will have a more positive deflection, and both Leads II and III will be negative. Heart conduction defects are seen in patients with left axis deviations.
Abnormal Rhythms and Waves
Once you have determined that the patient does not have a normal heart rate, take the next step into examining the waves in the abnormal rhythm.
How to read ECG strips to determine abnormal heart rhythms:
1.Disorganized – Irregularly Irregular
2.Patterned Irregularity – Regularly Irregular
Generally, there are 2 types of abnormal rhythms. By marking out some consecutive R-R intervals using a sheet of paper, you can compare the intervals along the strip, checking to see how the subsequent intervals vary.
In a situation where you suspect there may be atrioventricular block, examine the atrial and ventricular rates individually by marking the P and R waves. Check to see if QRS complexes are absent, the PR interval varies, or if there is a dissociation between the complexes and the intervals.
There are many specific irregular and abnormal heart rhythms. The more you can learn about the different patterns, the better you will be able to complete your ECG interpretations.
Bundle Blocks and Chamber Hypertrophies
A bundle branch block is a delay or a blockage along a path where electrical impulses travel to make the heartbeat. This can impede the patient’s heart’s ability to efficiently pump blood throughout the body. Bundle blocks occur on both left and right sides of the ventricles.
The left bundle branch blocks can be caused by:
- Myocardial infarctions
- Cardiomyopathy
- Myocarditis
- Hypertension
- The right bundle branch blocks can be caused by:
- Congenital abnormalities (such as an atrial septal defect)
- Myocardial infarctions
- Myocarditis
- Pulmonary hypertension
- Pulmonary embolisms
Look for the “bunny ears” on the ECG to help identify right bundle branch blocks, but be aware that they are not always there and this method is not 100% reliable.
Bundle blocks and chamber hypertrophies can be difficult to interpret. An atrial enlargement may not be too difficult to spot, but detecting left ventricular hypertrophy can prove challenging.
Acute MIs and Ischemic Findings
Acute findings for myocardial infarction (heart attack) on the ECG can be easily recognized.
Watch for anterior and inferior ST segment elevations or depressions.
The ST segment lies between the termination of S waves and initiation of T waves. In healthy hearts it is an isoelectric line which will not be elevated or depressed.
An ST segment elevation is considered to be significant at greater than a 1 mm in 2 + contiguous limb leads or more than 2mm in two or more of the chest leads.
The most common cause of an ST segment elevation is an acute, full thickness myocardial infarction.
An ST segment depression that is 0.5 mm or more in 2 or more contiguous leads will indicate a myocardial ischaemia.
An ST segment depression can be caused by digoxin ECG changes.
ECG interpretation by nurses, medical students, EMTs, vets, and internists is a vital skill when providing patient care. Taking an organized, systematic approach to each rhythm strip you encounter will provide you with more consistent and accurate results, and less frustration and time in the process.
If you are looking for ECG machines, or accessories such as EKG paper, talk to one of the experts at USAMedicalSurgical.com for more details. Call toll free today: 1-866-561-2380 or Email.
Medical Disclaimer: The purpose of our medical blog articles is to promote education and awareness around a range of medical, healthcare, and surgical solutions. This blog article was created for informational purposes only. This article is not a substitute for professional medical advice, diagnosis, or treatment. Always seek the advice of your physician or other qualified health provider with any questions you may have regarding a medical condition.